
Redistribution Correlates Positively with Corona Crash
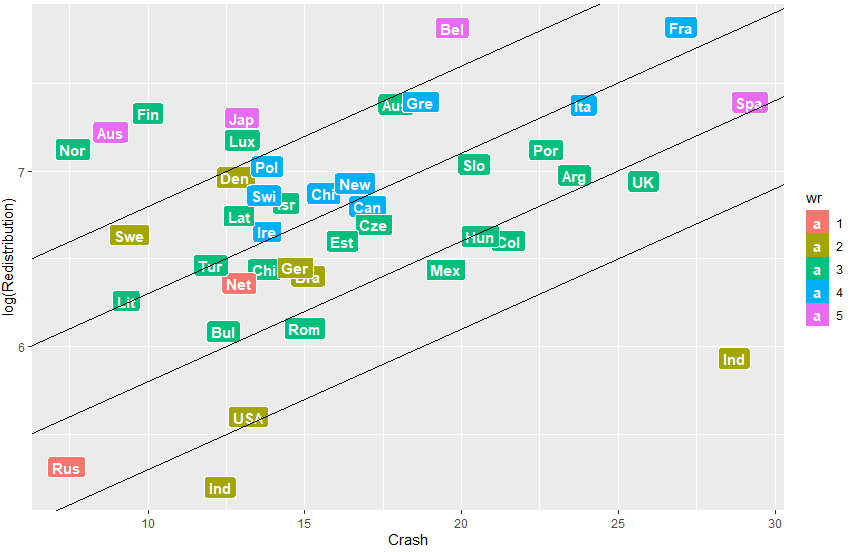
‘Redistribution’, the quantity shown on the vertical axis of the graph below, is a measure for the achievement of the socialist ideal: the higher this parameter, the smaller the gap between rich and poor. It is determined by taking into account taxation and government spending, as detailed below.
One of the ingredients of this parameter is the ratio of median and mean individual wealth for any given country: ‘wr’ represents this ratio multiplied by ten, and is shown in five color shades (see the bar legend). Worst score the Netherlands and Russia (reddish), while best score Austria, Japan, Belgium, and Spain (purplish).
‘Crash’, the quantity shown on the horizontal axis of the graph, is a measure for the loss in GDP suffered by a country as a consequence of the Corona season.
The graph below shows a positive correlation between Redistribution and Crash: that is to say, that on average, countries with a smaller gap between rich and poor suffer a higher blow from the Corona crisis.
What does the rest of the graph purport? One might interpret the slope of the indicator lines as the price an economy has to pay for redistributing wealth among its citizens. Given their choice for redistribution, the best economic performers are Norway, Austria, and Finland, and the worst India (high Crash value) and Indonesia (lower Crash value). On the other hand, upon considering the economic performance independently from one’s choice for redistribution, India and Spain are the worst, while Russia and Norway the best economic performers.
The quantity ‘Crash’ was calculated as YoY(2019q3)+YoY(2019q4)-YoY(2020q1)-YoY(2020q2). Here, YoY represents the fractional change of the country’s GDP for a given quarter with respect to that a year before. For example, the fractional change in the third quarter of 2019 is YoY(2019q3)=GDP(2019q3)/GDP(2018q3). Positive growth implies YoY>0, and shrinkage YoY<0. Consequently, ‘Crash’ measures how the economy of the first half year of 2020 fared, compared to the preceding half year. Seasonal correction is granted by YoY, because it compares two subsequent years for a given season.
‘Redistribution’ was calculated as SE*WR*TR, with SE standing for Social Expenses as a fraction of GDP, WR for wealth ratio (the same quantity shown in the legend), and TR for tax rates.
On their own turn, these quantities were calculated as follows: SE=TGE-ME-INT, with TGE standing for total government expenses, ME for military expenses, and INT for interest paid on the deficit; WR=WPA_median/WPA_mean, the ratio of median and mean wealth per individual adult; TR=CT+IT+ST+20*WT is a weighed sum of corporate, income, sales, and wealth (or property) taxes.
For a graphical illustration of the concepts mean and median, see the appendix to this post.
Data Taken From
https://en.wikipedia.org/wiki/List_of_countries_by_government_spending_as_percentage_of_GDP
https://data.worldbank.org/indicator/MS.MIL.XPND.GD.ZS
https://en.wikipedia.org/wiki/List_of_countries_by_wealth_per_adult
https://en.wikipedia.org/wiki/List_of_countries_by_public_debt
https://stats.oecd.org/index.aspx?queryid=350
https://en.wikipedia.org/wiki/List_of_countries_by_tax_rates