Present-day democracies have been receding steadily, during the last century, from the ideal that every citizen has equal opportunities. Fundamental ingredients of equal opportunities are not only the formal availability of educational resources to all citizens, irrespective of their skin color and sex, but also the real availability of financial resources. Not for nothing, such an ideal is not realizable on this planet. However, the difference between trying to achieve such an ideal and trying to achieve the opposite, remains. As a case study I would like to present the situation in my own country: The Netherlands.
Many Dutch people believe that their own country distributes wealth quite fairly among its citizens, but the opposite is true: The Netherlands is one of the worst-performing pupils in the class of democratic countries.
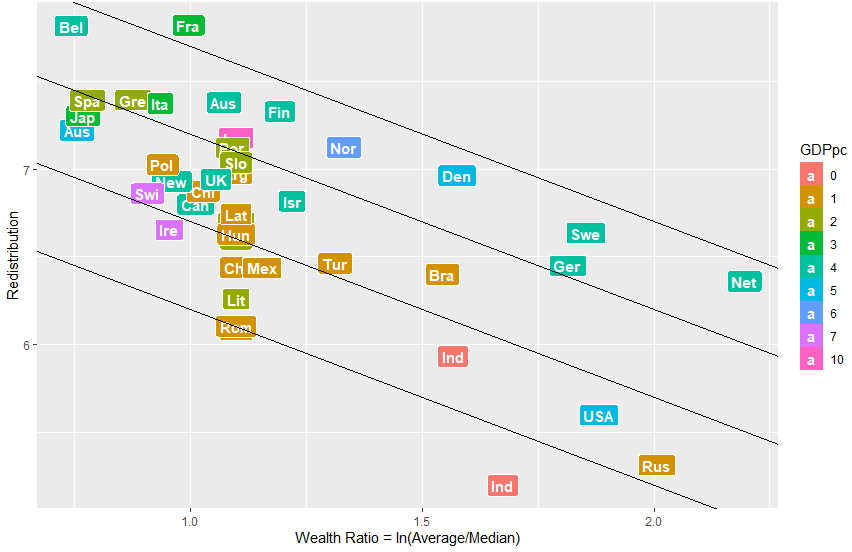
Redistribution (y-axis) versus Wealth Ratio (abscissa)
The color code represents the nominal GDP per capita
The wealth Ratio is defined as the natural logarithm of the ratio of the average and median wealth per adult. In this respect, the Netherlands performs worst of all countries shown in the graph, closely followed by Russia and the US. The two “Ind” labels refer to India and Indonesia, the latter scoring the lowest degree of redistribution, preceded by Russia and the US (again). The redistribution parameter was calculated from
Redistribution = Tax Rates * Government Expenses / GDP / Wealth Ratio
Tax Rates = Corporate TR + Income TR + Sales TR + 20 * Wealth TR
The quantities in these equations can be weighted according to everyone’s taste, but as long as the sign of the weights is correct, the final result will not be very different from the one shown above.
In the Netherlands, 10% of the adult population holds 64% of all wealth, according to the pertinent Governmental Institute (Central Bureau of Statistics). However, this figure is calculated incorrectly, for it does not take into account the Public Debt. And Who pays for that debt? Every citizen pays its equal part. Well well, what do we see here? That our democracies, so impotent as they are in redistributing wealth equally among its citizens, apparently have no troubles at all when it comes to distributing taxation equally. Given the huge political problems implied in the former endeavor, the near perfect realization of the latter seems almost a miracle. That even taxation is not perfect, stems from the increasing possibilities for tax evasion (the favorite topic on golf courts and in high society parties) with increasing wealth.
Now what happens, in the Netherlands, when one takes into account Public Debt? In 2017 the Dutch Public Debt amounted to $ 518.5 billion, corresponding to k$ 30.5 per capita. With an adult population (under 20) of 88%, this implies a Dutch Public Debt of k$ 34.6 per adult. In that case, the same 10% richest people do not hold 64% of all wealth, but 100%. Yes: all of it. The rest of us combined (90% of the Dutch citizens) owns nothing: The richer citizens in that 90% category owns just enough to compensate for the debts of the poorer ones. This can be readily estimated from the Dutch governmental data, as shown in the graph below, which refers to the wealth distribution in the Netherlands in 2017.
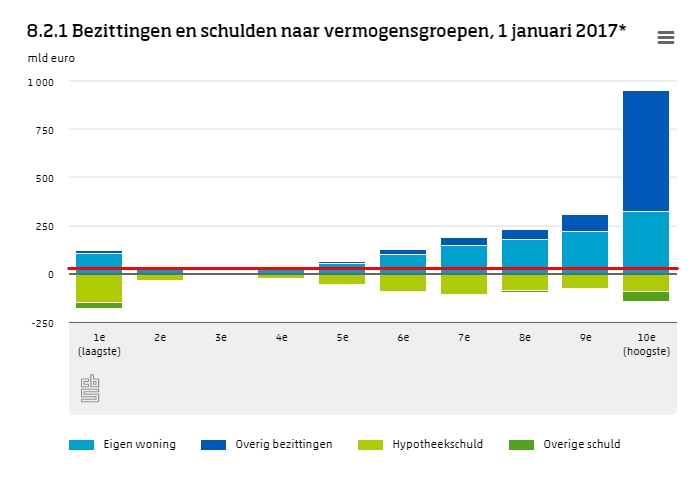
Property (blue) and Debt (green) for Ten Wealth Quantiles in the Netherlands (2017)
Correction for Public Debt implies raising the abscissa to the red level
(5% of the total Public Debt, about € 20 billion)
The unit on the y-axis is € 1 billion (~ US$ 1.2 billion)
Color Legends: Own House and Other Property (blue), Mortgage and Other Debt (green)
The graph shows that the first quantile has a net debt, the second and third show a net cancellation of property and debt, and the six highest quantiles have net property. Correcting for the Public Debt is achieved by lifting the abscissa by about € 20 billion, which is half the public debt for every quantile. Consequently, in reality the six first quantiles have net debt, and the last four net property; likewise, the property of the 7th through 9th quantiles approximately cancel the debts of the first six percentiles.
The same information can be expressed in terms of mean and median values for wealth. In the Netherlands, they amount to k$ 279.1 and k$ 31.1 per adult, respectively. When adjusted for the public debt, these two already quite unbalanced numbers become k$ 244.5 and k$ -3.5 per adult, respectively. The PublicDebt-corrected median wealth takes a dive into the red, while the tenth quantile shrinks by only 12%!
Equal opportunities in the Netherlands? Not in my dictionary…
And yet, my enlightened Dutch liberal friends cannot believe that all the Main Stream Media are in the hands of a few tyrants, who censor everything which jeopardizes their poverty-plucking parasite position.
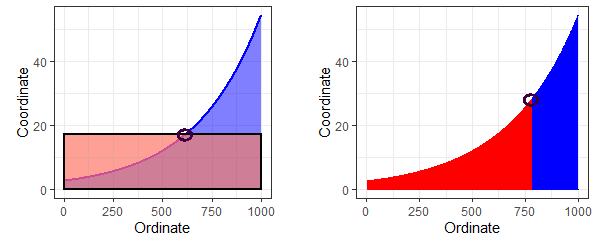
Appendix: Mean and Median
Mean and Median both come in two species: as coordinate (y) and as ordinate (x) values.
mean median