
Tony Heller is a geologist (BS at Arizona State University, Boston University) / geochemist (University of New Mexico), Electrical Engineer (Masters at Rice University) and computer scientist (Northern Arizona University, Colorado State University). He is a lifelong environmentalist. Although he does not hold a specific academic degree in that field, his posts demonstrate that he has all the knowledge necessary to obtain such a degree. Indeed, he testified several times at Congressional hearings in support of Wilderness: for the first time, in 1972.
Tony Heller has a great climate site, on which he regularly posts evidence of IPCC fraud. Below are some examples taken from his website. Here he compares NASA data from two different years. Clearly, the data have been manipulated.
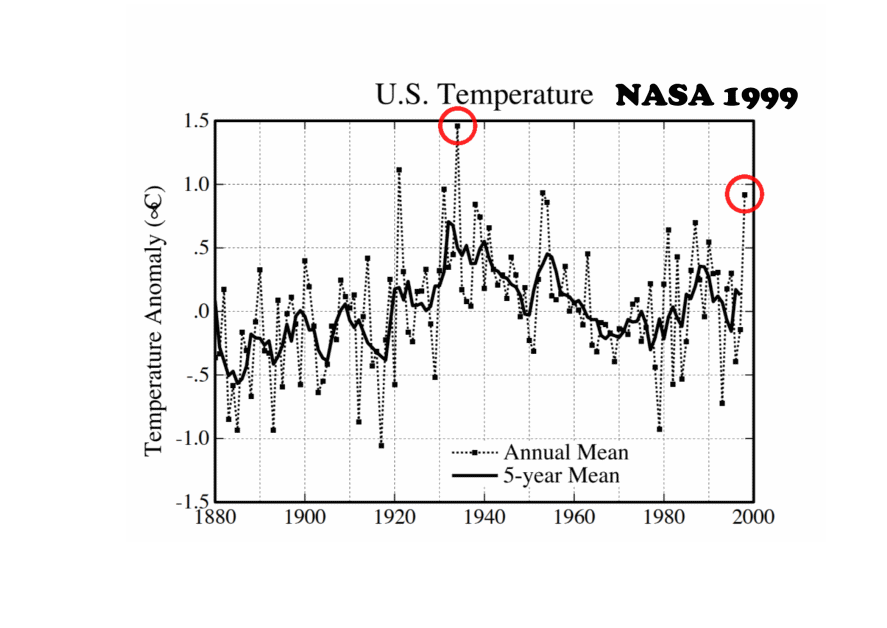
Annual and 5-year mean US temperature as provided by NASA in 1999
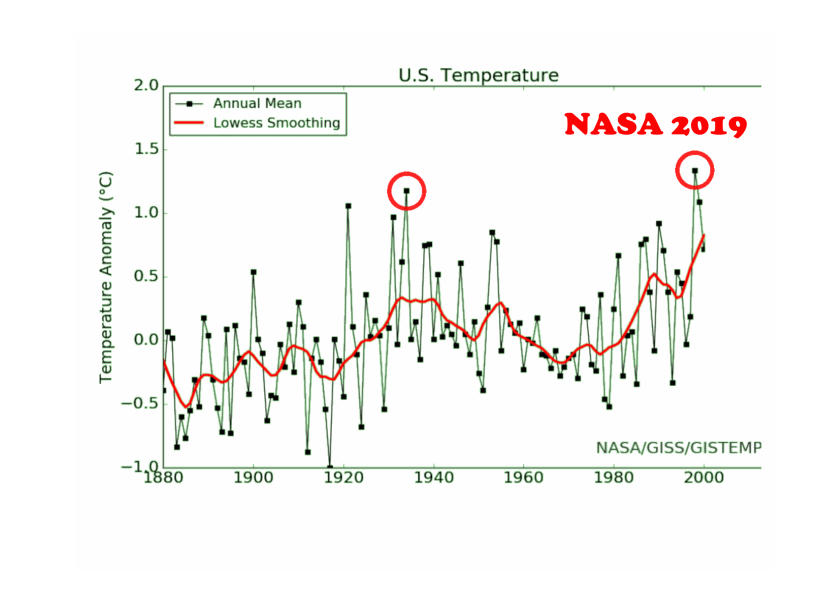
Annual and ten-year mean US temperature as provided by NASA in 2019
From the 1930’s onward, the 1999 data show a downward trend, while the faked 2019 data show an upward trend.
The seal level is another case in point. In Florida, it rises at an average rate of 2.5 mm per year. In Sweden, however, the sea level drops, and even faster, at 3.8 mm per year!
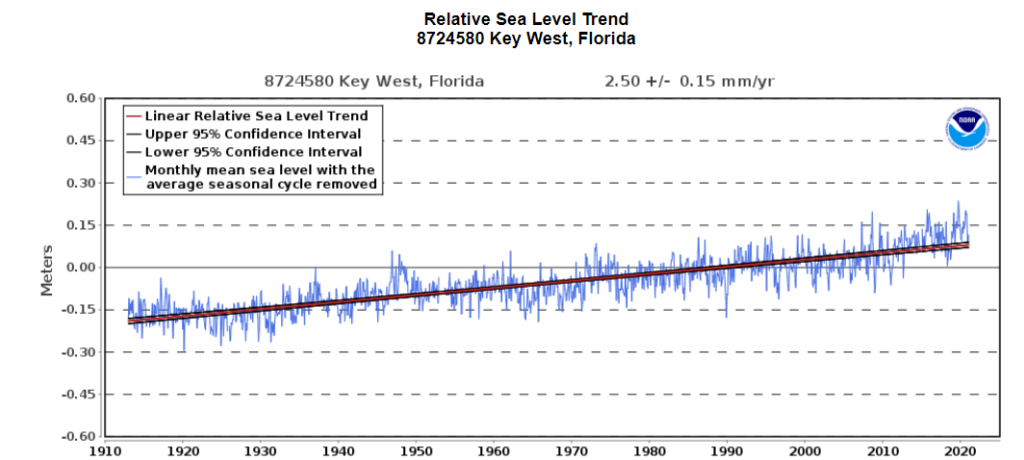
Sea level rise in Florida over the past century: the rate is 2.5 mm per year
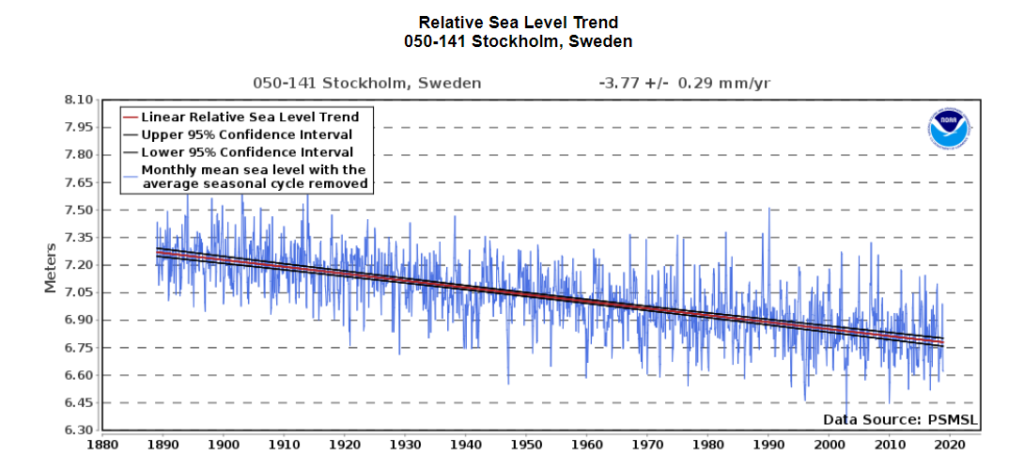
Sea level drop in Stockholm over the past century: the drop rate is 3.8 mm per year
It is funny to see that, according to the IPCC parish, the sea level does not correlate with global temperature. Here is what Michael Mann, Raymond S. Bradley, and Malcolm Hughes would have us believe in their 1999 publication (Geophysical Research Letters 26, 759). The graph spans a whole millennium.
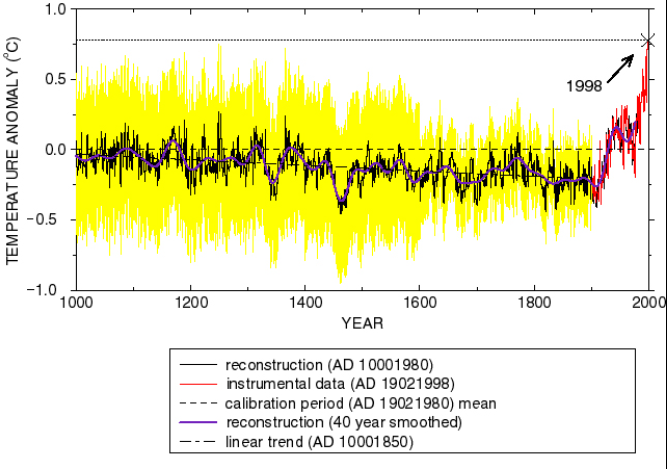
Global temperature over the last millennium according to Hockey-Mann
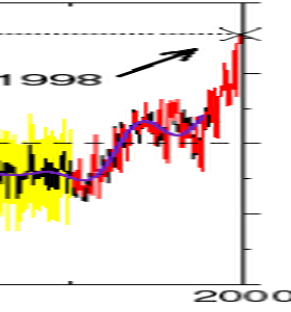
Global temperature over the past century according to Hockey-Mann
These data roughly span the last century of the millennium graph at the left
Why did NASA manipulate the US temperature data? Probably, they are on the same payroll as Hocky-Mann
As one can readily appreciate, the Hockey stick is a fraud: it does not correlate with US global temperature, nor with sea level measurements. Mann, Bradley, and Hughes consciously tampered with the data: given the enormous repercussions, they should be tried, and if found guilty, sentenced to prison.
Anyway, the sea level rise rate should be placed into its proper perspective. Here is what it looks like, over the past 24 millennia:
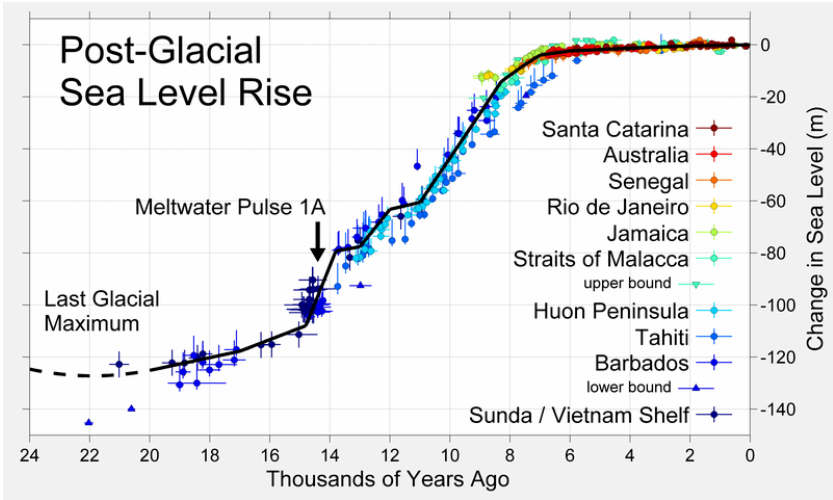
Relative (with respect to today) seal level over the past 24 millennia
The numbers are in meters, and they obviously do not indicate a yearly change in sea level
I guess the sea level rise of 120 meter in about 8000 years was not due to our ancestors’ agricultural activity on planet earth. Hence, it is a natural phenomenon. This phenomenon clearly saturates over the past 6000 years. Is it so hard to conclude that, whatever occurs today, on the few millimeter per year scale, is but a consequence of the same natural phenomenon? If natural global cooling sets in at a rate of 15 mm per year, there is nothing humanity can do about it. So let us put the temperature trends into their natural perspective. Back in 1990, IPCC collaborators still were allowed to publish the real data.
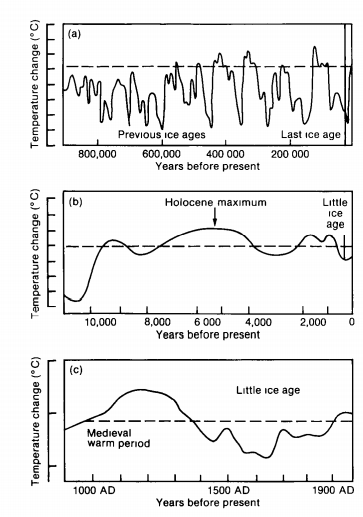
Global Temperature trends on three different time scales:
(a) one million years
(b) ten thousand years
(c) one thousand years
Figure (a) shows that natural fluctuations in the global temperature, from one glacial period to the next, cover about 5⁰ Celsius. During the “little ice age” 500 years ago, which separates us from the middle ages, it was but 1⁰ Celsius cooler than it is now, and all Northern European lakes froze over.
On a one million year time scale (still peanuts in comparison with the age of our planet), sea level differences of 120 meter and concomitant global temperature changes of 5⁰ Celsius occurred repeatedly, with two distinct periods: one of about 100 thousand years, and another one of about 10 thousand years. Needless to say in principle that these cycles have natural causes: though quite opportune, when addressing IPCC parishioners.
There is no reason to assume that the future will be otherwise: unless we humans can do something about it. For the time being, there exists no thread of a proof that humans can contribute to temperature rise, even though we know exactly how much heat humanity produces every year. Apparently, the human contribution to global warming is so exceedingly small (compared to natural phenomena) that nobody has been able to observe it.
Note that figure (c) shows that, during the past 20 thousand years, the global temperature has been uniformly rising, at a high rate. This phenomenon fully correlates with the global sea level, shown above.
So what kind of natural phenomena could play a role in global earth temperatures? It is known that the length of the solar activity cycle (about 11 years) shows a much stronger correlation with global temperature than does the carbon dioxide concentration.
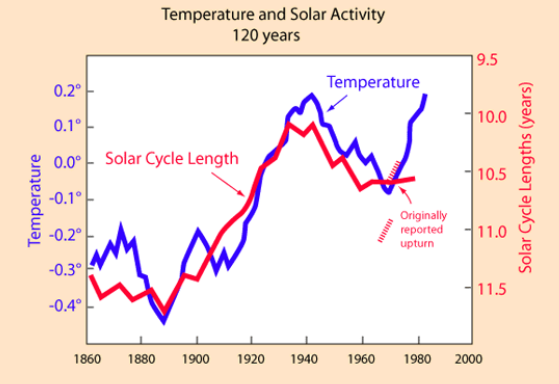
The length of solar activity cycles (red line, right coordinate axis)
and global temperature (blue line, left coordinate axis, 11-year running mean), over the past century.
The above figure is due to Durkin, based on data published by Eigil Friis-Christensen and Knud Lassen in 1994 (International Astronomical Union Colloquium 143, pages 339 – 347). Did I read the criticism? Sure I did. I was not impressed, though. How much of a scientific genius does one have to be to concede that the internal solar dynamics is a prime player in the global temperature fluctuations measured on planet Earth? Of course, the match is not perfect. As long as the global temperature fluctuations over 5⁰ Celsius (over the past million years) have not been understood in their finest detail, it seems rather dumb to search for a human contribution, which nobody knows might be as small as a percent of a percent of a percent of those 5⁰ Celsius.